YouTube Data Extraction and Visualization

Research Summary
This project observed the YouTube’s Videos category, counts, likes and comments based per country and its relation to each other. This project answers the question Our analysis focuses on answering below questions: Is there a significant difference in the average like count of the top 50 videos within each designated region within YouTube? Ha:Average like count will be significantly different between the regions H0: There is no difference between the average like count by region
Is there a significant difference in the average like count of the top 50 videos of each designated category within YouTube? Ha: Average like count will be significantly different between the categories H0: There is no difference between the average like count by category
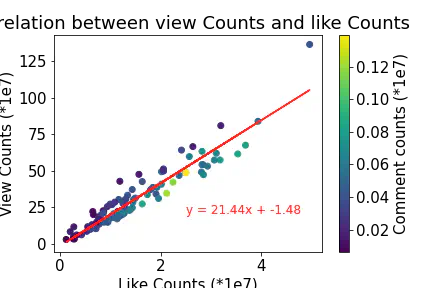
Additional Correlations: What is the average percent of videos liked by the number of views they have received?
Project is built to call the YouTube API’s dataset related to Video . Due to large size, dataset is saved in CSV file for further analysis(5000 records). Python matplotlib, bar graph, pie charts are used to analyzed the data and specify the correlation in between videos, categories, likes, views and counts. Various methods such a correlation, aggregation, t-test, comparison , ANOVA tests are used to do further analysis of data.